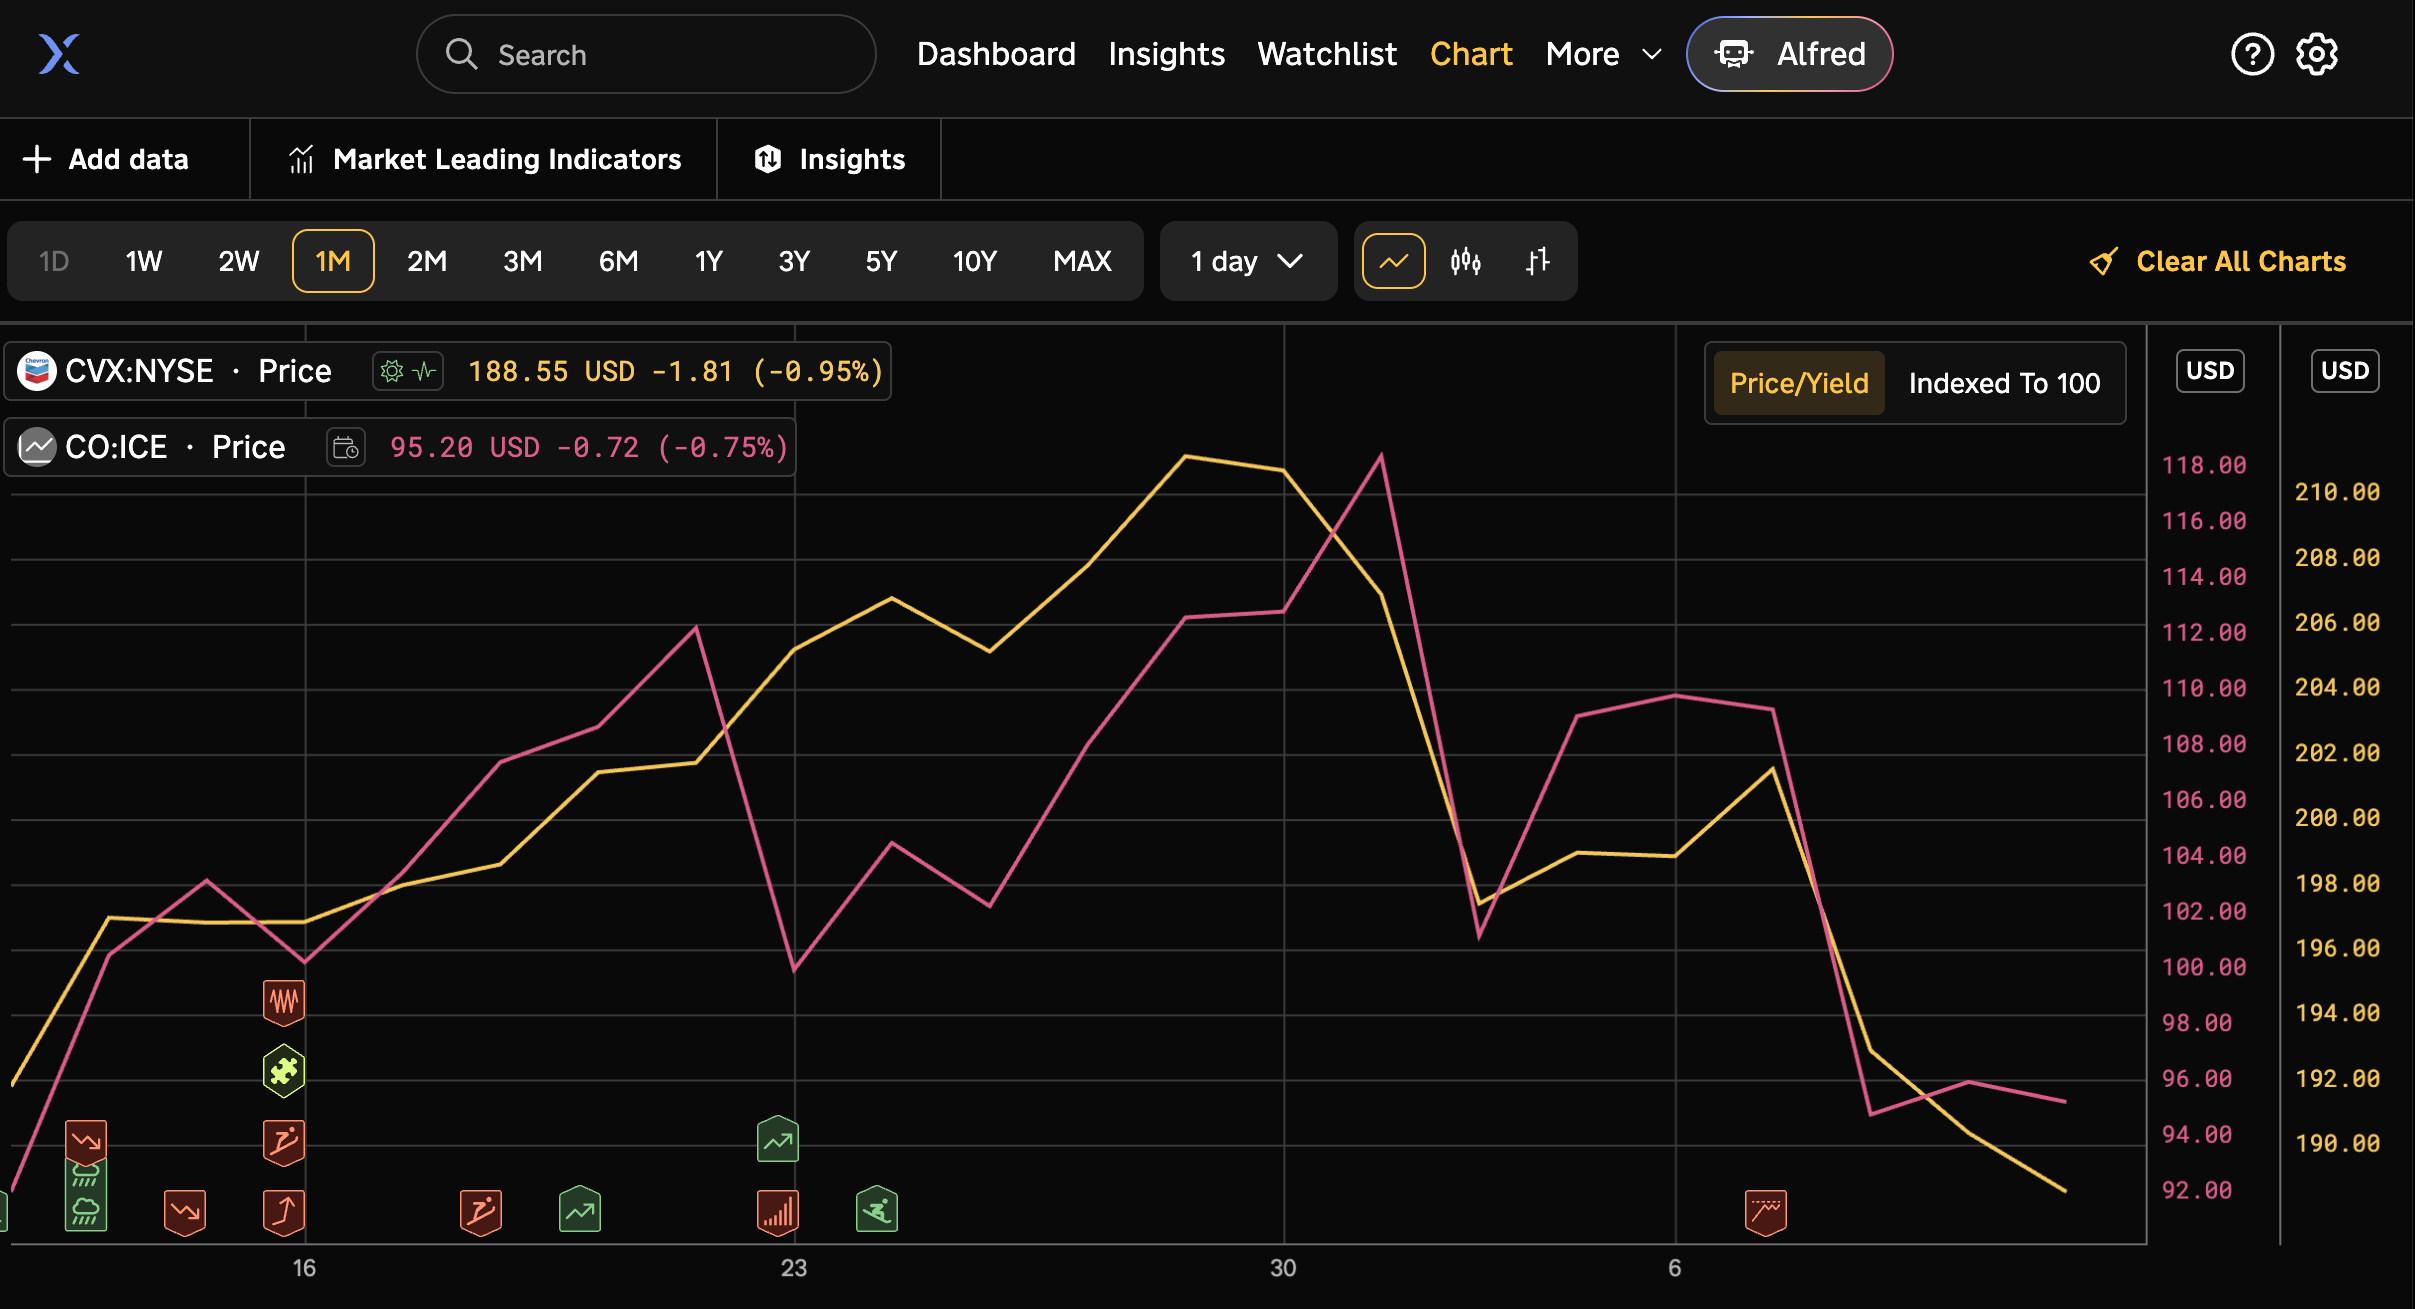
The Chart in Reflexivity integrates time series data, events, and Connections data into one chart interface. You can plot one or multiple assets on the chart, and can plot any return-based metric.
You can also create charts and visualizations via Alfred. Just head to Alfred and ask for the visualization you want returned. Alfred has a wider variety of visualizations available than the Chart function, and can create the right one for your needs.